
Google Analytics: Capture sources, page views, CTAs, form starts, and inquiry completions to identify drop-off points and compare before/after changes.
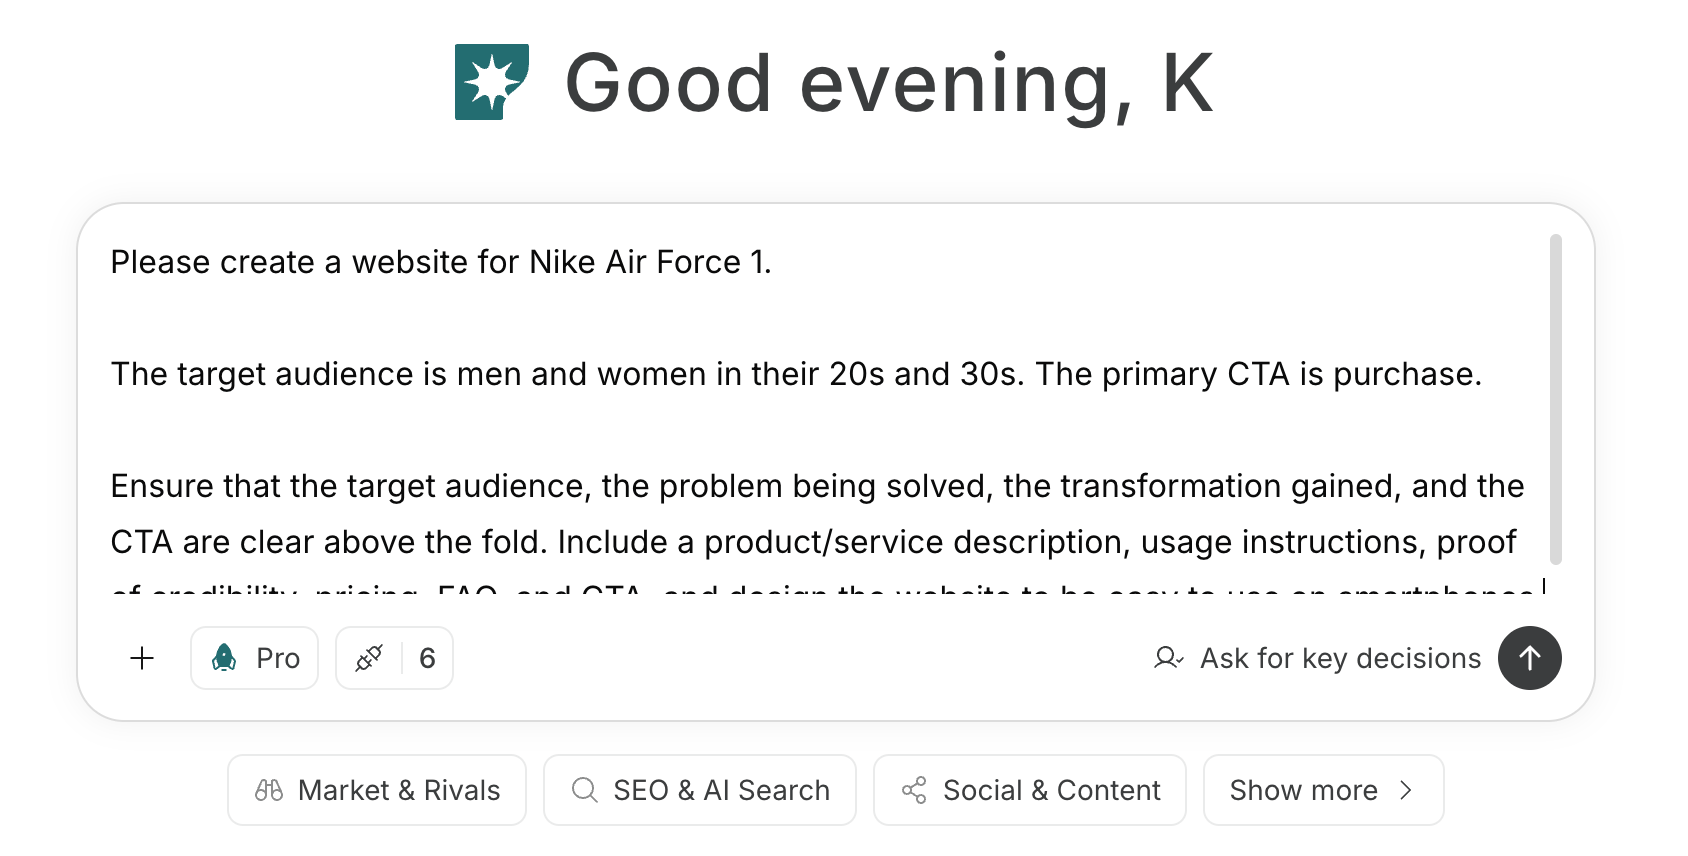 To create an agent from a prompt, see [Create an agent from chat](/help-center/ai-team/create-a-trigger-from-chat). To set up manually, see [Create an agent from scratch](/help-center/ai-team/create-an-agent-from-scratch).
 ### 1. Decide which conversion step to improve and how to measure it
Connect Google Analytics and input your public URL, main contact methods, and events you can capture into the chat.
Ask NoimosAI to map the consultation journey and identify the events that mark the start and completion of each stage. Use only data you can reliably obtain, then select the conversion step where an improvement would have the greatest impact.
#### Prompt for chat
```text theme={null}
For [website URL], map the journey from the service page to [consultation, inquiry, quote request, or appointment booking].
Check the pages and events available in Google Analytics and summarize how to measure the start and completion of each conversion step, how to calculate CVR, the segments to mainly compare, and other metrics to check simultaneously. Do not assume actions you cannot measure; list them separately as candidates for additional measurement.
```
Choose one conversion step you can measure and where improvement will have the biggest impact.
### 2. Identify where visitors drop off and why
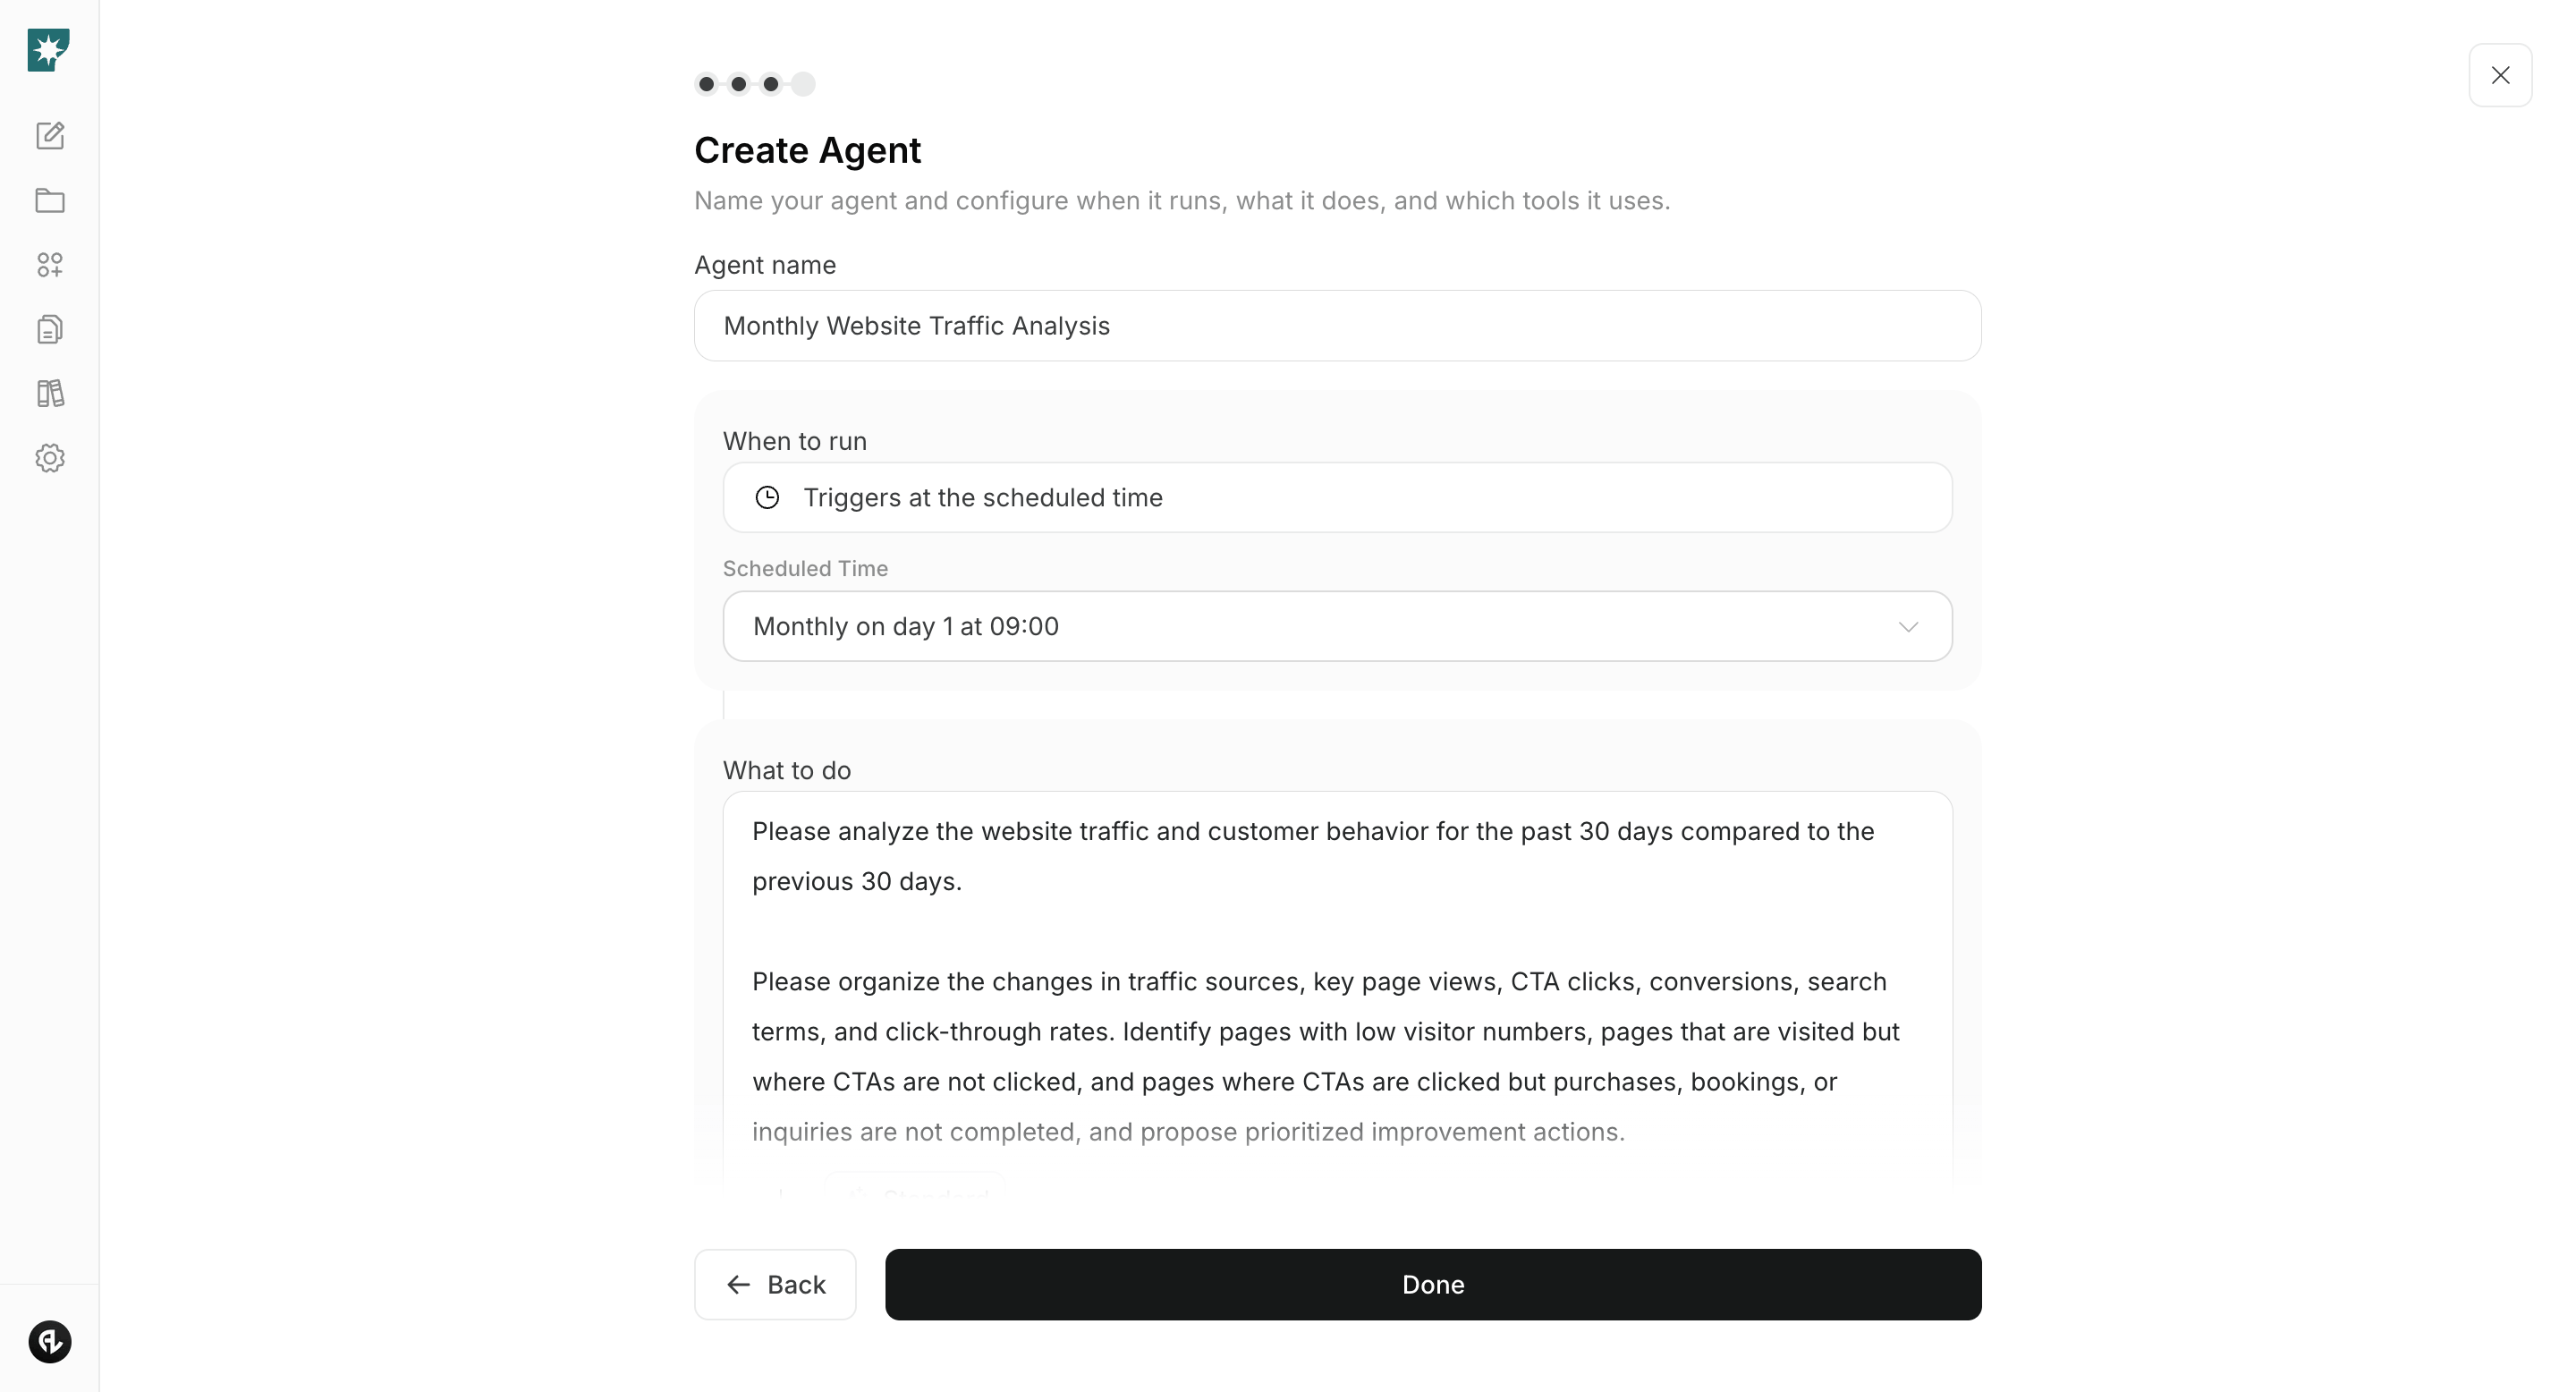
Create an agent to compare the most recent 30 days with the preceding 30 days for the chosen conversion step. From changes by source, page, and device, find where drop-off increased, review the page and form content, and narrow the cause to a single fix.
#### Agent setup
**Trigger:** Schedule / Monthly
**Instructions:**
```text theme={null}
Compare the most recent 30 days in Google Analytics with the previous 30 days.
Report traffic and CVR by source, key service/case-study/pricing page, CTA, form start, and inquiry completion. Identify material changes by source, page, or device. Review the affected page’s target client, problem, outcome, case studies, scope, pricing, CTA, and form, then present the most likely high-impact cause of drop-off, the supporting evidence, and the recommended fix.
```
**Integrations:** Google Analytics
Compare the analysis with the actual page, form, and recurring questions in inquiries, then decide on one cause to fix.
### 3. Improve pages, CTAs, and forms
Pass the identified cause into chat and update the target page or form. Avoid changing unrelated areas; produce the final copy, implementation checklist, and metrics to measure after the change.
#### Prompt for chat
```text theme={null}
Based on this chat's analysis, improve [target page or form].
Address the drop-off cause by updating the target customers, problems, offered outcomes, case studies, scope, pricing, request flow, CTA, input fields, errors, and post-submission guidance. Summarize the changes, provide the final copy, provide implementation check items, and list the metrics to check after the change.
```
Confirm facts and constraints, then apply changes to the website or form. Also confirm you are not asking for more sensitive information than necessary in inquiries.
### 4. Compare CVR and inquiry content before and after changes
Once data is collected, compare before vs after under the same conditions.
Enter the change date, content, and comparison period into chat to check directly improved CVR and effects on inquiry quality. Based on results, decide whether to keep the change, modify it, or test another cause.
#### Prompt for chat
```text theme={null}
In Google Analytics, compare the page or funnel [changed page or flow] before and after the change. The change date is [date], and the change details are [details].
Use comparable periods, sources, and devices. Report the directly affected CVR, completed inquiries, and changes in key-page views. I will also provide [counts and categories of qualified inquiries]. Evaluate both inquiry volume and the qualified share, then recommend whether to keep the change, revise it, or test a different hypothesis.
```
**Integrations:** Google Analytics
Do not input personal information—use only counts and classifications. If CVR rises but out-of-scope inquiries increase, review sources, target customers, and scope descriptions.
## Related pages
* [Build and improve a website](/playbooks/client-services/build-website)
* [Research competitors](/playbooks/client-services/research-competitors)
* [Google Analytics](/help-center/integrations/analytics-and-data/google-analytics)
### 1. Decide which conversion step to improve and how to measure it
Connect Google Analytics and input your public URL, main contact methods, and events you can capture into the chat.
Ask NoimosAI to map the consultation journey and identify the events that mark the start and completion of each stage. Use only data you can reliably obtain, then select the conversion step where an improvement would have the greatest impact.
#### Prompt for chat
```text theme={null}
For [website URL], map the journey from the service page to [consultation, inquiry, quote request, or appointment booking].
Check the pages and events available in Google Analytics and summarize how to measure the start and completion of each conversion step, how to calculate CVR, the segments to mainly compare, and other metrics to check simultaneously. Do not assume actions you cannot measure; list them separately as candidates for additional measurement.
```
Choose one conversion step you can measure and where improvement will have the biggest impact.
### 2. Identify where visitors drop off and why
Create an agent to compare the most recent 30 days with the preceding 30 days for the chosen conversion step. From changes by source, page, and device, find where drop-off increased, review the page and form content, and narrow the cause to a single fix.
#### Agent setup
**Trigger:** Schedule / Monthly
**Instructions:**
```text theme={null}
Compare the most recent 30 days in Google Analytics with the previous 30 days.
Report traffic and CVR by source, key service/case-study/pricing page, CTA, form start, and inquiry completion. Identify material changes by source, page, or device. Review the affected page’s target client, problem, outcome, case studies, scope, pricing, CTA, and form, then present the most likely high-impact cause of drop-off, the supporting evidence, and the recommended fix.
```
**Integrations:** Google Analytics
Compare the analysis with the actual page, form, and recurring questions in inquiries, then decide on one cause to fix.
### 3. Improve pages, CTAs, and forms
Pass the identified cause into chat and update the target page or form. Avoid changing unrelated areas; produce the final copy, implementation checklist, and metrics to measure after the change.
#### Prompt for chat
```text theme={null}
Based on this chat's analysis, improve [target page or form].
Address the drop-off cause by updating the target customers, problems, offered outcomes, case studies, scope, pricing, request flow, CTA, input fields, errors, and post-submission guidance. Summarize the changes, provide the final copy, provide implementation check items, and list the metrics to check after the change.
```
Confirm facts and constraints, then apply changes to the website or form. Also confirm you are not asking for more sensitive information than necessary in inquiries.
### 4. Compare CVR and inquiry content before and after changes
Once data is collected, compare before vs after under the same conditions.
Enter the change date, content, and comparison period into chat to check directly improved CVR and effects on inquiry quality. Based on results, decide whether to keep the change, modify it, or test another cause.
#### Prompt for chat
```text theme={null}
In Google Analytics, compare the page or funnel [changed page or flow] before and after the change. The change date is [date], and the change details are [details].
Use comparable periods, sources, and devices. Report the directly affected CVR, completed inquiries, and changes in key-page views. I will also provide [counts and categories of qualified inquiries]. Evaluate both inquiry volume and the qualified share, then recommend whether to keep the change, revise it, or test a different hypothesis.
```
**Integrations:** Google Analytics
Do not input personal information—use only counts and classifications. If CVR rises but out-of-scope inquiries increase, review sources, target customers, and scope descriptions.
## Related pages
* [Build and improve a website](/playbooks/client-services/build-website)
* [Research competitors](/playbooks/client-services/research-competitors)
* [Google Analytics](/help-center/integrations/analytics-and-data/google-analytics)