- Decide which conversion stage to improve and how to measure it
- Identify where users drop off and why
- Improve acquisition pages and the flow to first value
- Compare CVR before and after changes to determine next steps
Understand conversion fundamentals
For software and apps, there are multiple conversion points from discovery to completed sign-up, first-value experience, and paid conversion. Web services often convert via a website, mobile apps via a store page install, and desktop apps via download/installation from a website or store. Map the flow according to your distribution method and choose one conversion point where many users drop off and which has significant business impact. When improving CVR, decide the action you want users to complete and how you’ll measure it, then identify where and why users drop off. Next, fix the high-impact page or flow and compare performance before and after under the same conditions.1. Decide which conversion stage to improve and how to measure it
First, decide which stage’s CVR you will improve. Because sign-up methods and paid conversion rules vary by product, align the actual screens and measurable events with your onboarding flow. Do not collapse sign-up, onboarding, and paid conversion into a single CVR metric; measure each conversion stage separately. The table below maps typical conversion stages to the completion actions and the starting population (denominator) used for CVR calculation.
Measure activation using the action where users first obtain the product’s value—not simply login or screen views. For example: first created artifact for a design tool, first report viewed for an analytics tool, or sharing with team members for a collaboration tool.
Use the data available at each stage of the journey. Confirm that events such as sign-up start, first launch, sign-up completion, activation, and paid conversion are recorded in Google Analytics for the website and product. Check store impressions, product-page views, and installs in App Store Connect or Google Play Console. When combining numbers from different sources, align the time period, geography, operating system, and campaign. Do not estimate actions that are not tracked.
2. Identify where users drop off and why
After choosing conversion stages, inspect the user journey as a . Segment not only by overall CVR but also by acquisition source, device, new vs returning, and usage intent to make it easier to choose improvement targets. The table below connects each drop-off point with the first evidence to inspect and the most relevant type of fix.
Prioritize by the number of affected target users and the business impact as well as the drop-off rate. A registration screen where many suitable users stall or an upgrade flow where activated users leave usually deserves attention before a screen reached by very few people.
3. Improve acquisition pages and the flow to first value
Choose one area and make a change tied to the supported cause of drop-off. Instead of redesigning the entire page or flow at once, begin with the element closest to the point where users cannot continue. Key improvements include:- Value messaging: Be specific about the target user, problem solved, outcomes, and how you differ from alternatives
- Store page: Present app name, icon, screenshots, video, and description in that order to communicate target users, main use cases, outcomes, and required permissions/compatibility
- CTAs: Use text that clarifies what will happen after clicking (e.g., Sign up, Try free, Install, Upgrade)
- Pricing and plans: Compare price units, included features, usage limits, and free plan/free trial conditions in the same layout
- Sign-up: Move inputs and selections not necessary for initial use later; show where errors occur and how to fix them
- Activation: Prioritize actions required to reach first value and provide samples, templates, and setup guidance
- Paid conversion: Link the value users have already gained to the additional value from upgrading
- Trust signals: Place security, data handling, cancellation terms, support, reviews, and case studies near decision points
4. Compare CVR before and after changes to decide next improvements
After changes, compare CVR before and after using the same conversion stage, user segments, devices, and acquisition sources. If campaigns or day-of-week cause big variance, match the comparison periods accordingly. Which metrics to check alongside CVR depends on what you improved.
If testing multiple changes at once, use an A/B test to compare the original and variant during the same period. If you are not running an A/B test, record the change, publication date, and target users so you can distinguish its effect from other changes made at the same time.
If CVR increases but activation or retention drops, you may be attracting users outside your target. Don’t judge by sign-ups alone—track first-value experience, paid conversion, and retention before deciding next actions.
Apps you can use for conversion analysis
For CVR improvement you’ll analyze user behavior and, as needed, update web pages. Use these apps.
Google Analytics: Collect events you set up for acquisition, sign-up start, first launch, sign-up completion, activation, and paid conversion. Use it to build funnels, identify drop-off points, and compare before/after results.
Improve conversion rates with NoimosAI
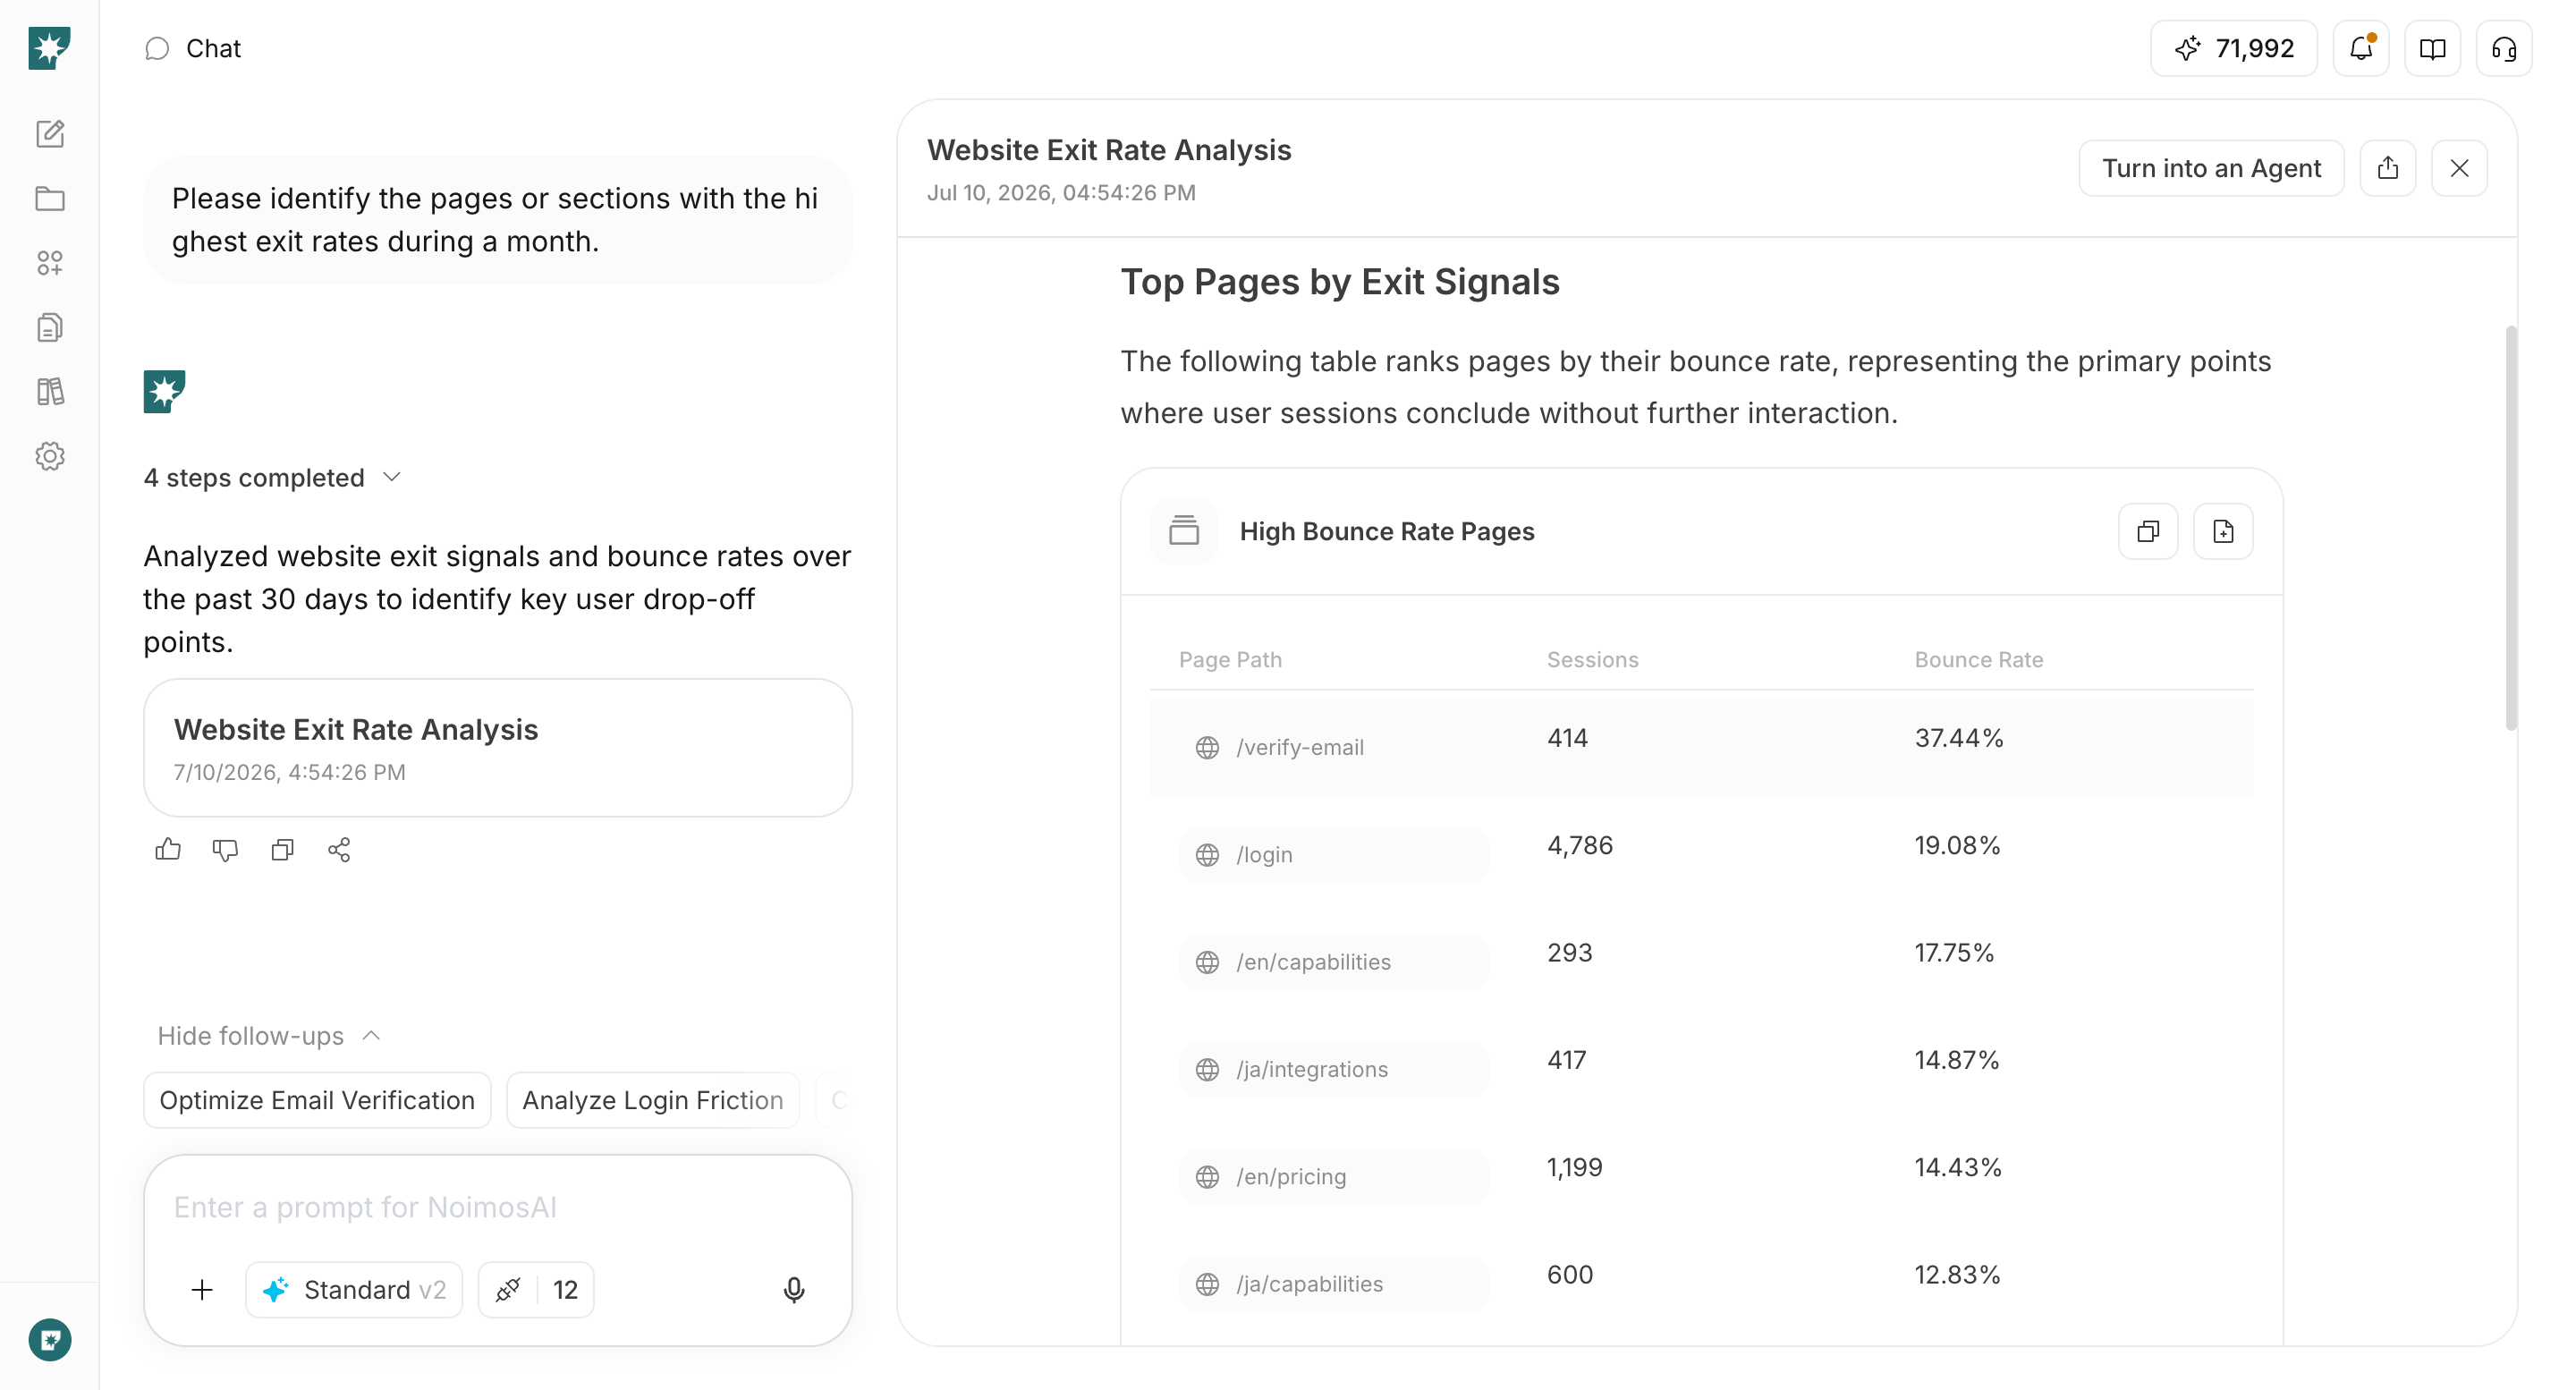
Choose the conversion stage to improve, identify where users drop off, fix the relevant acquisition pages and in-product flows, and compare CVR before and after the changes. For instructions on entering a prompt in chat, see Enter your own prompt.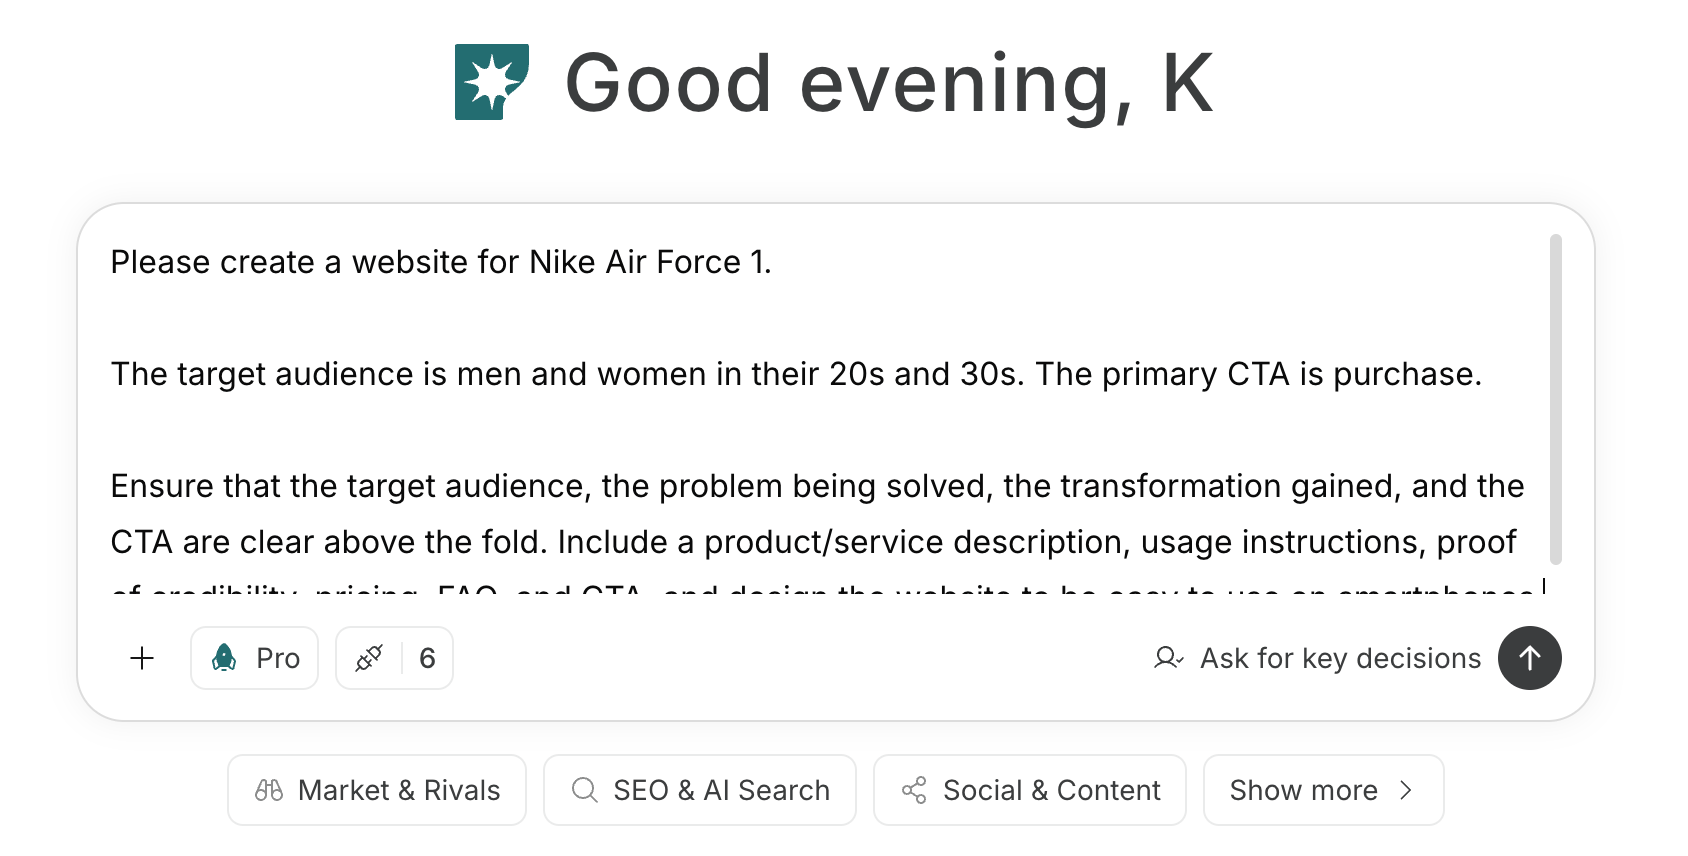
1. Decide which conversion stage to improve and how to measure it
Connect Google Analytics and use chat to map the flow from sign-up to paid conversion and the events you actually have. Enter distribution channels such as website, App Store, Google Play, and the action you want users to take to obtain first value. If analyzing store impressions or installs, prepare the metrics from the distribution console.Prompt for chat
2. Identify where users drop off and why
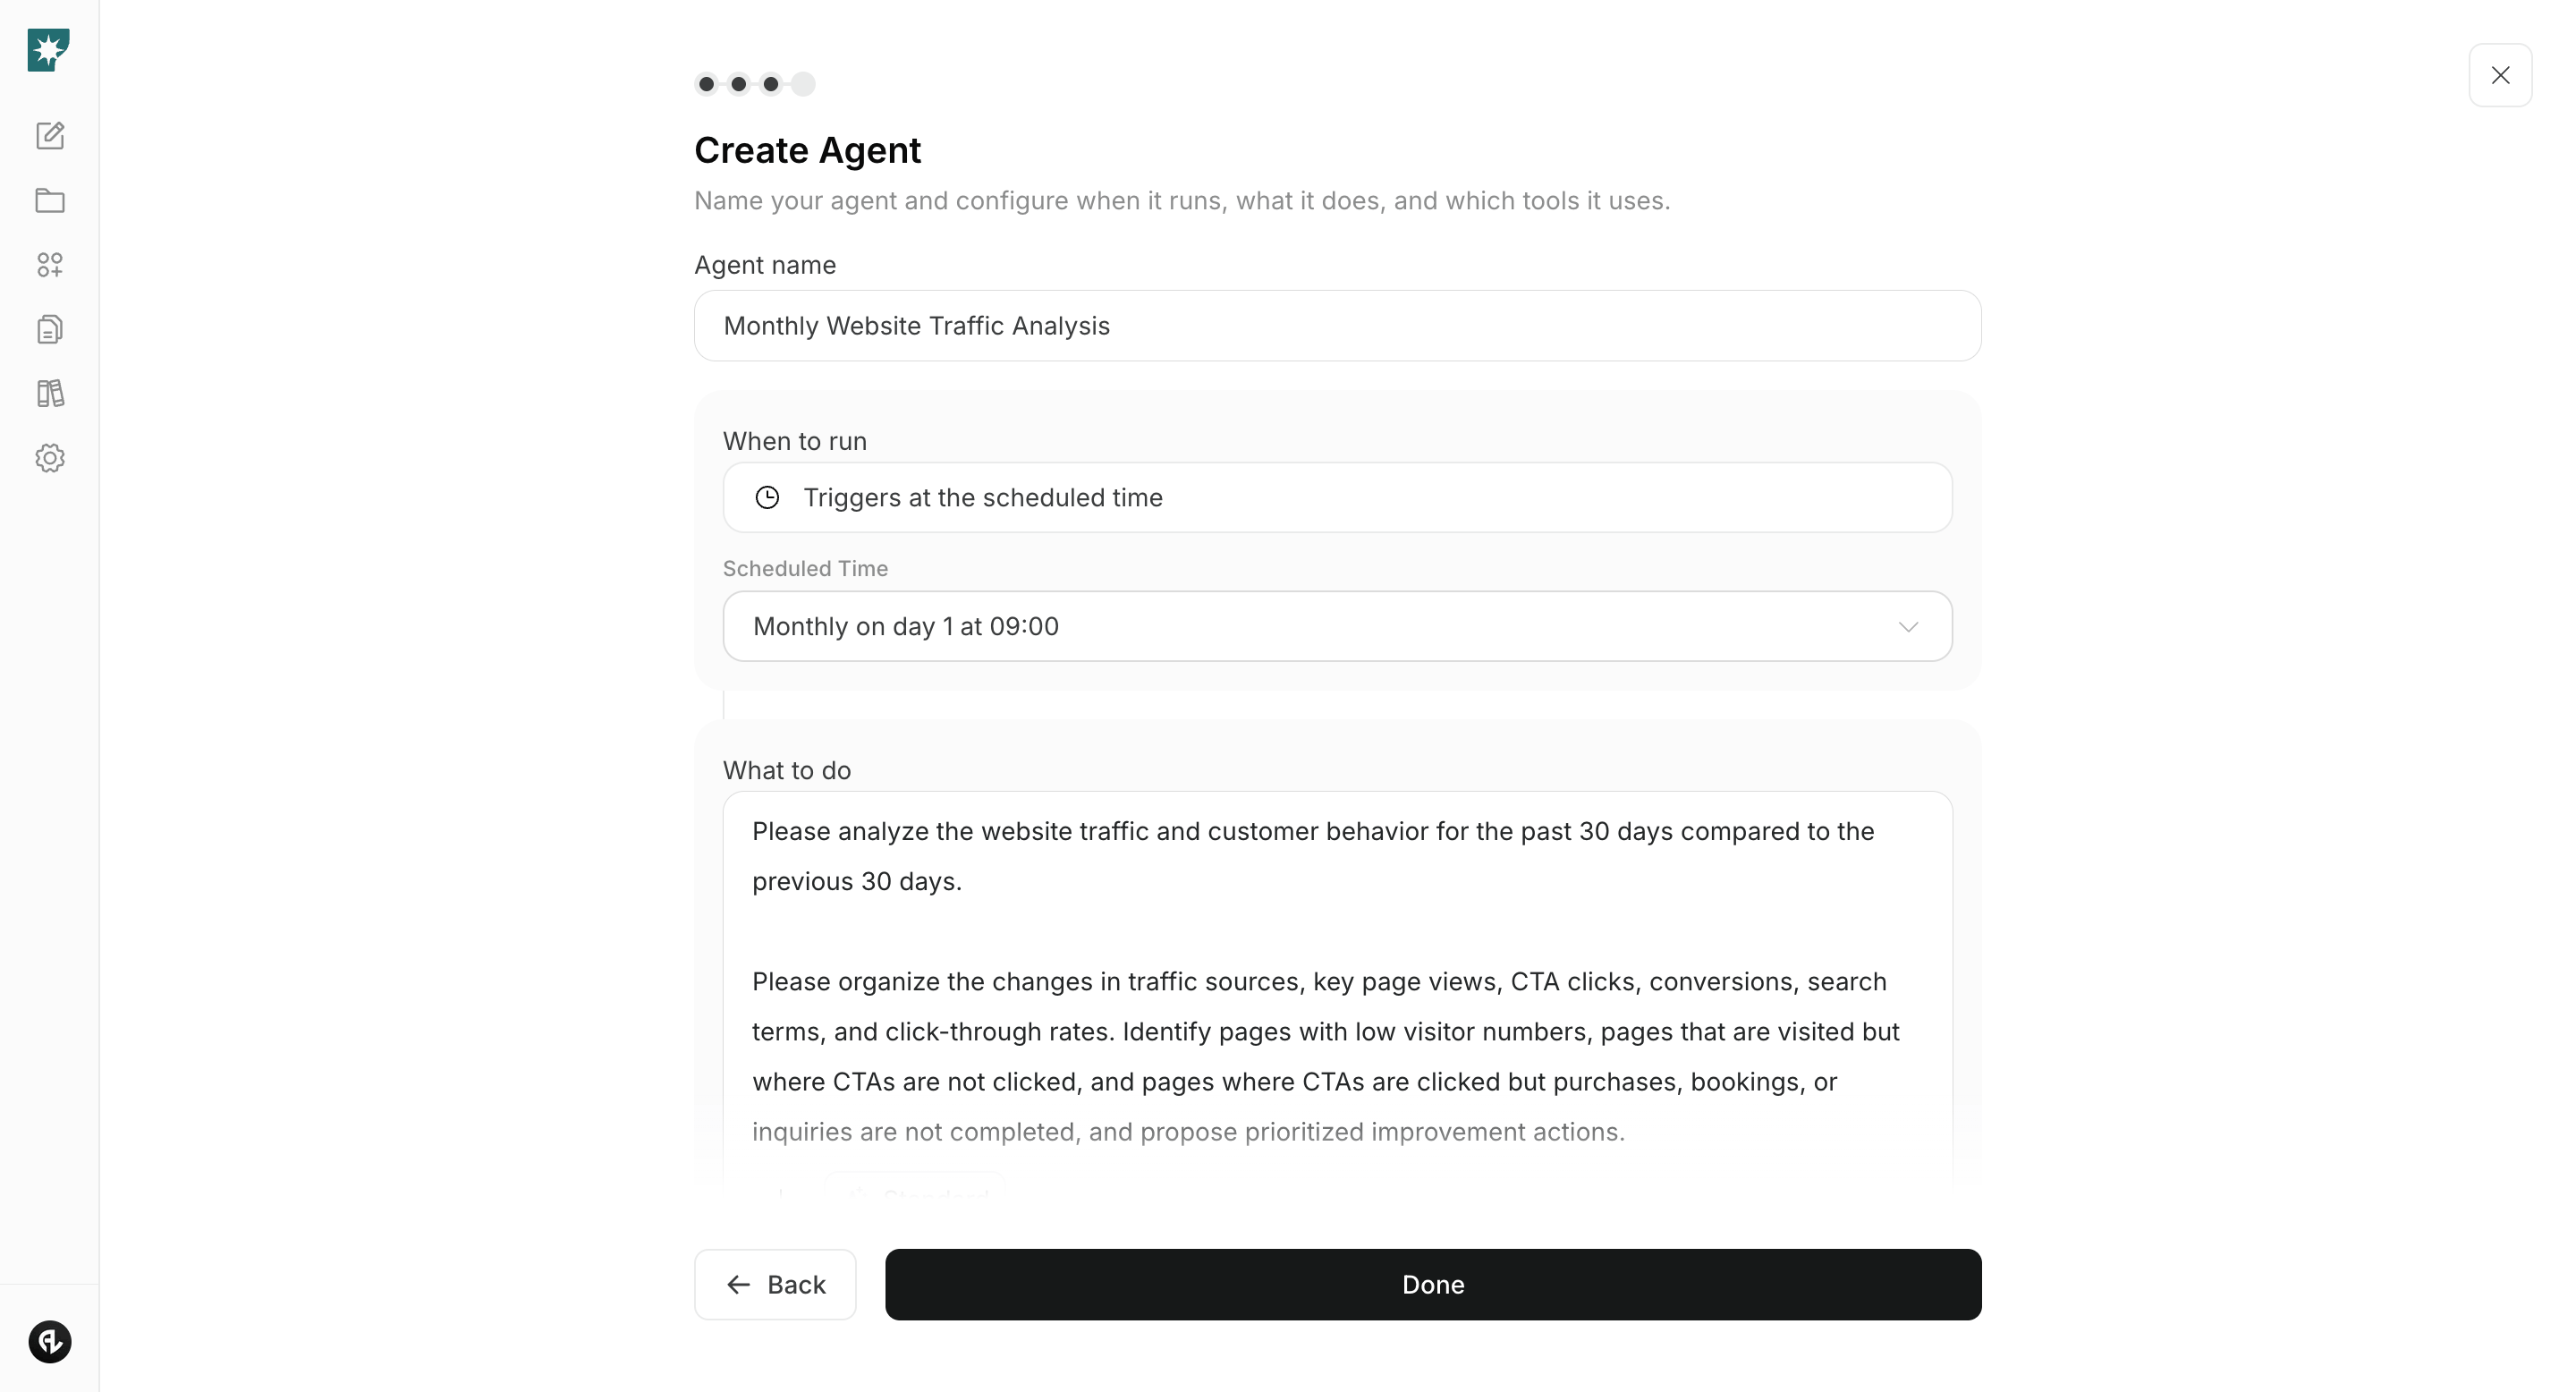
Create an agent that checks chosen conversion stages weekly and proposes fixes for the highest-impact drop-off points. Also check differences by acquisition source and device to surface problems hidden by overall averages.Agent setup
Trigger: Schedule / Weekly Instructions: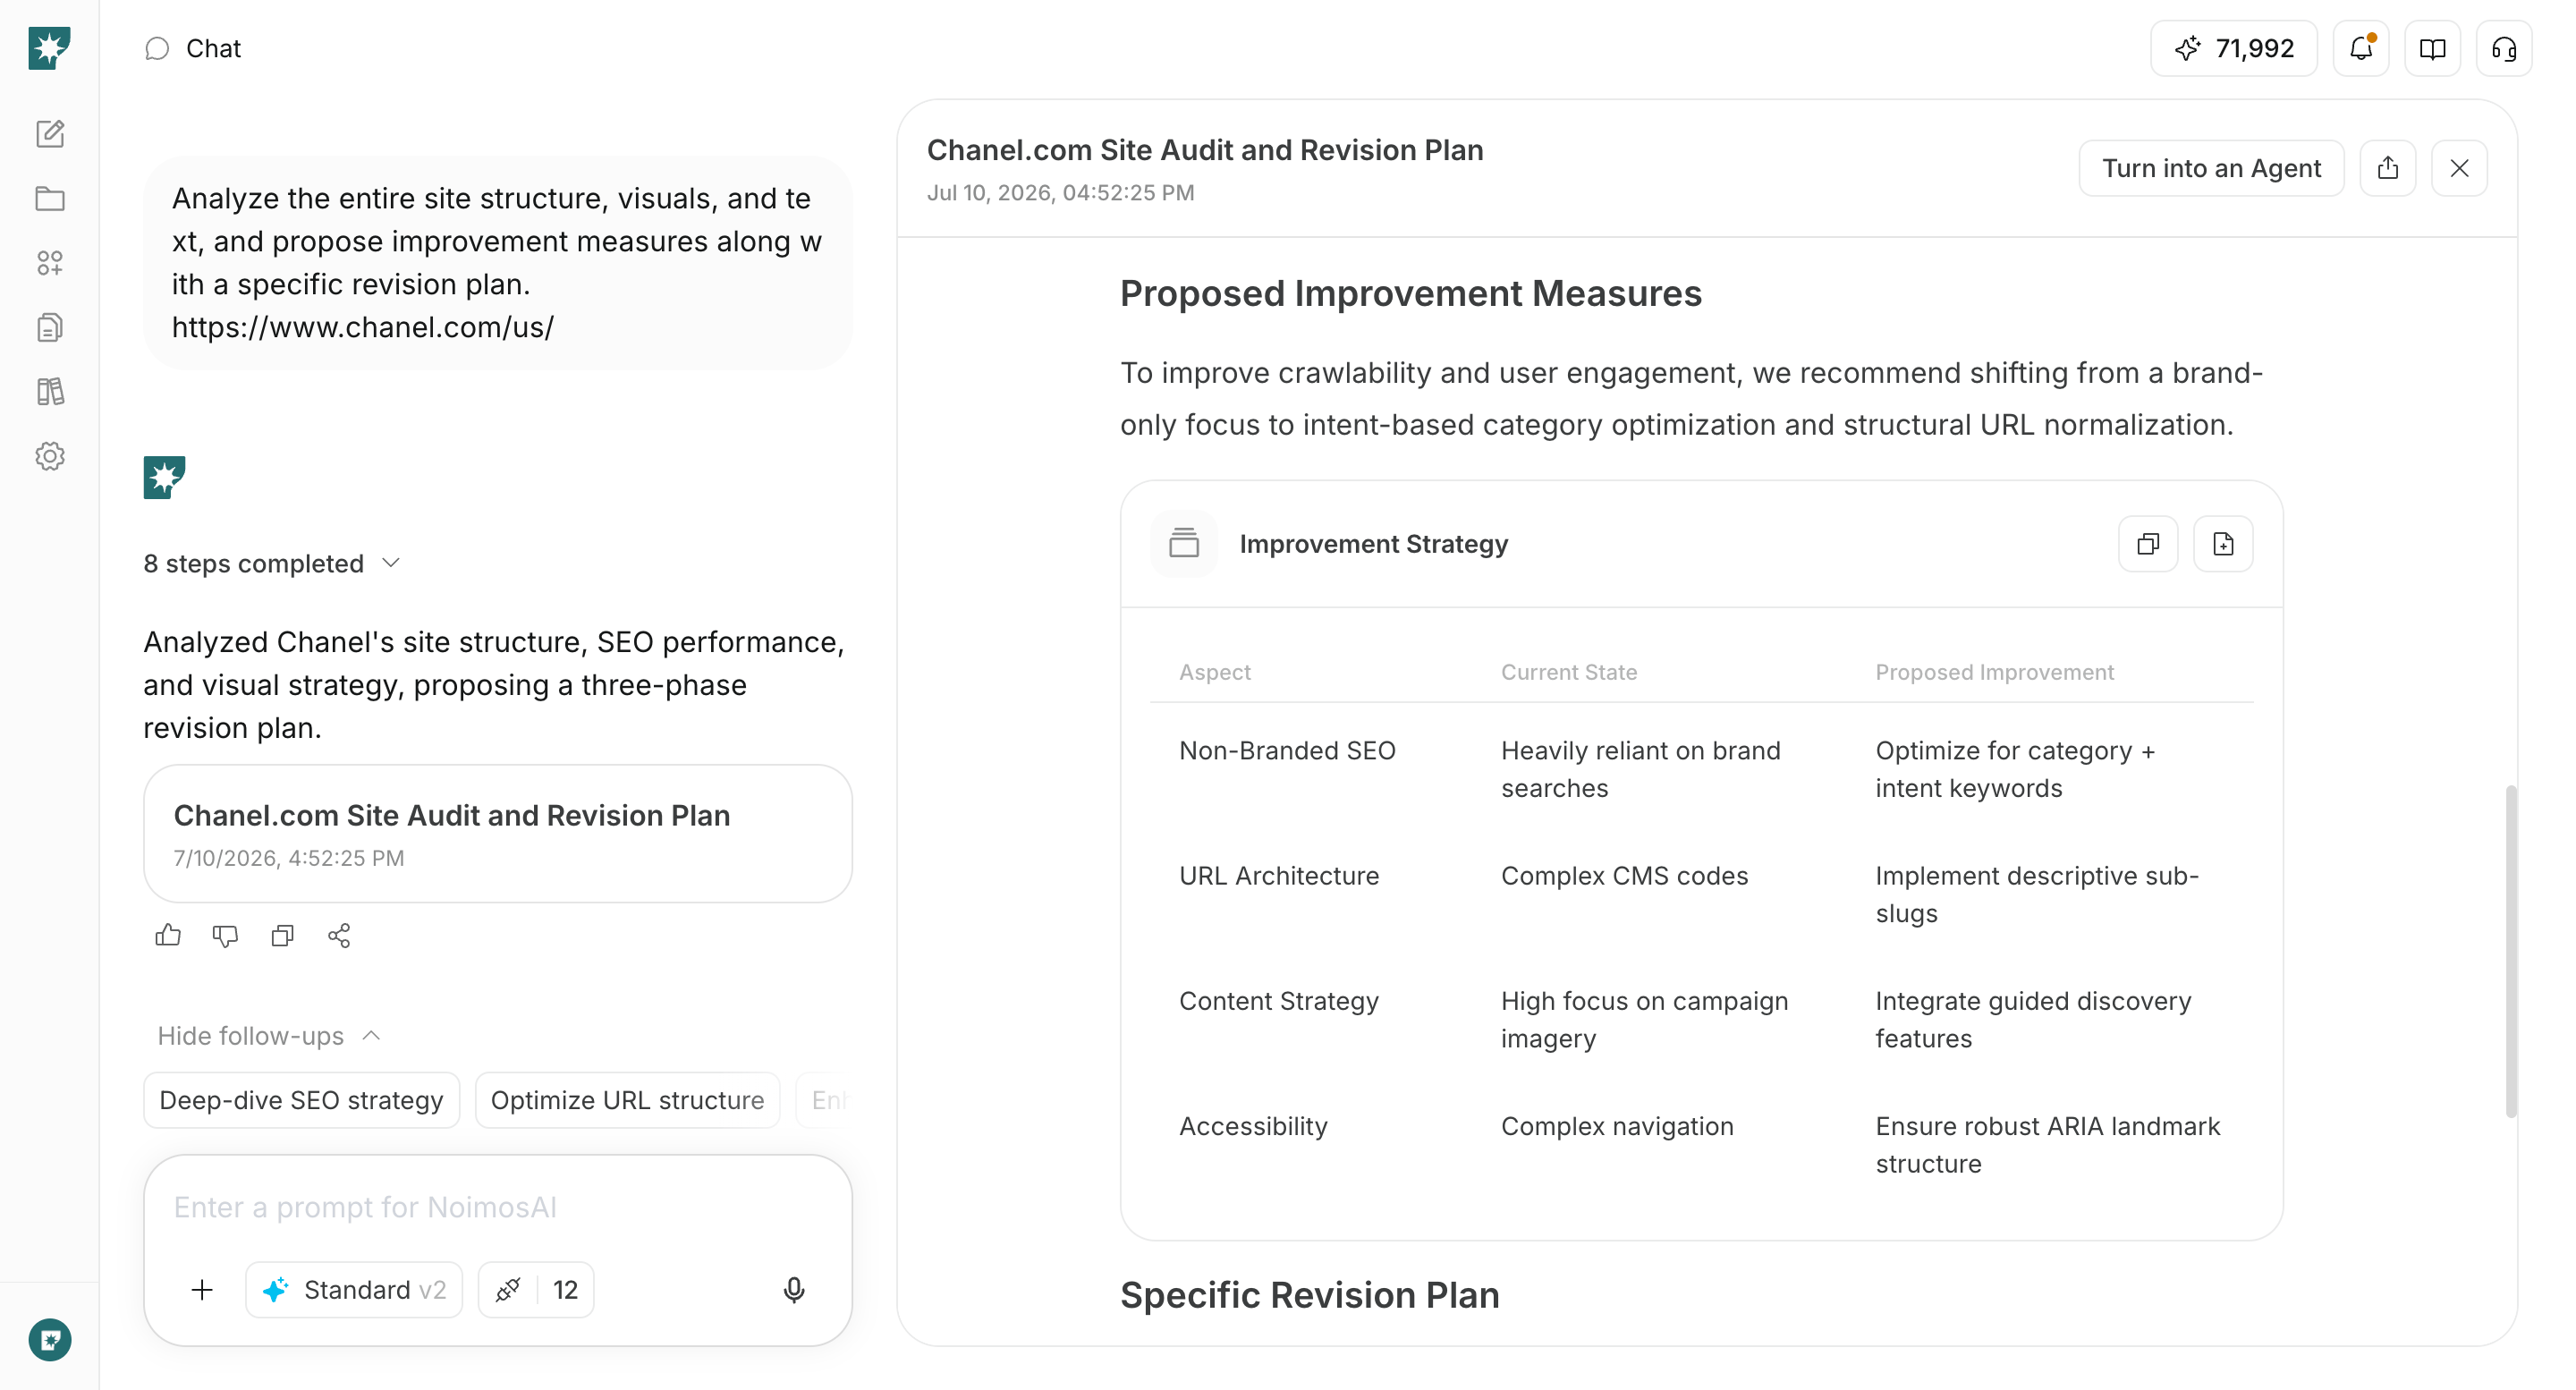
3. Improve acquisition pages and the flow to first value
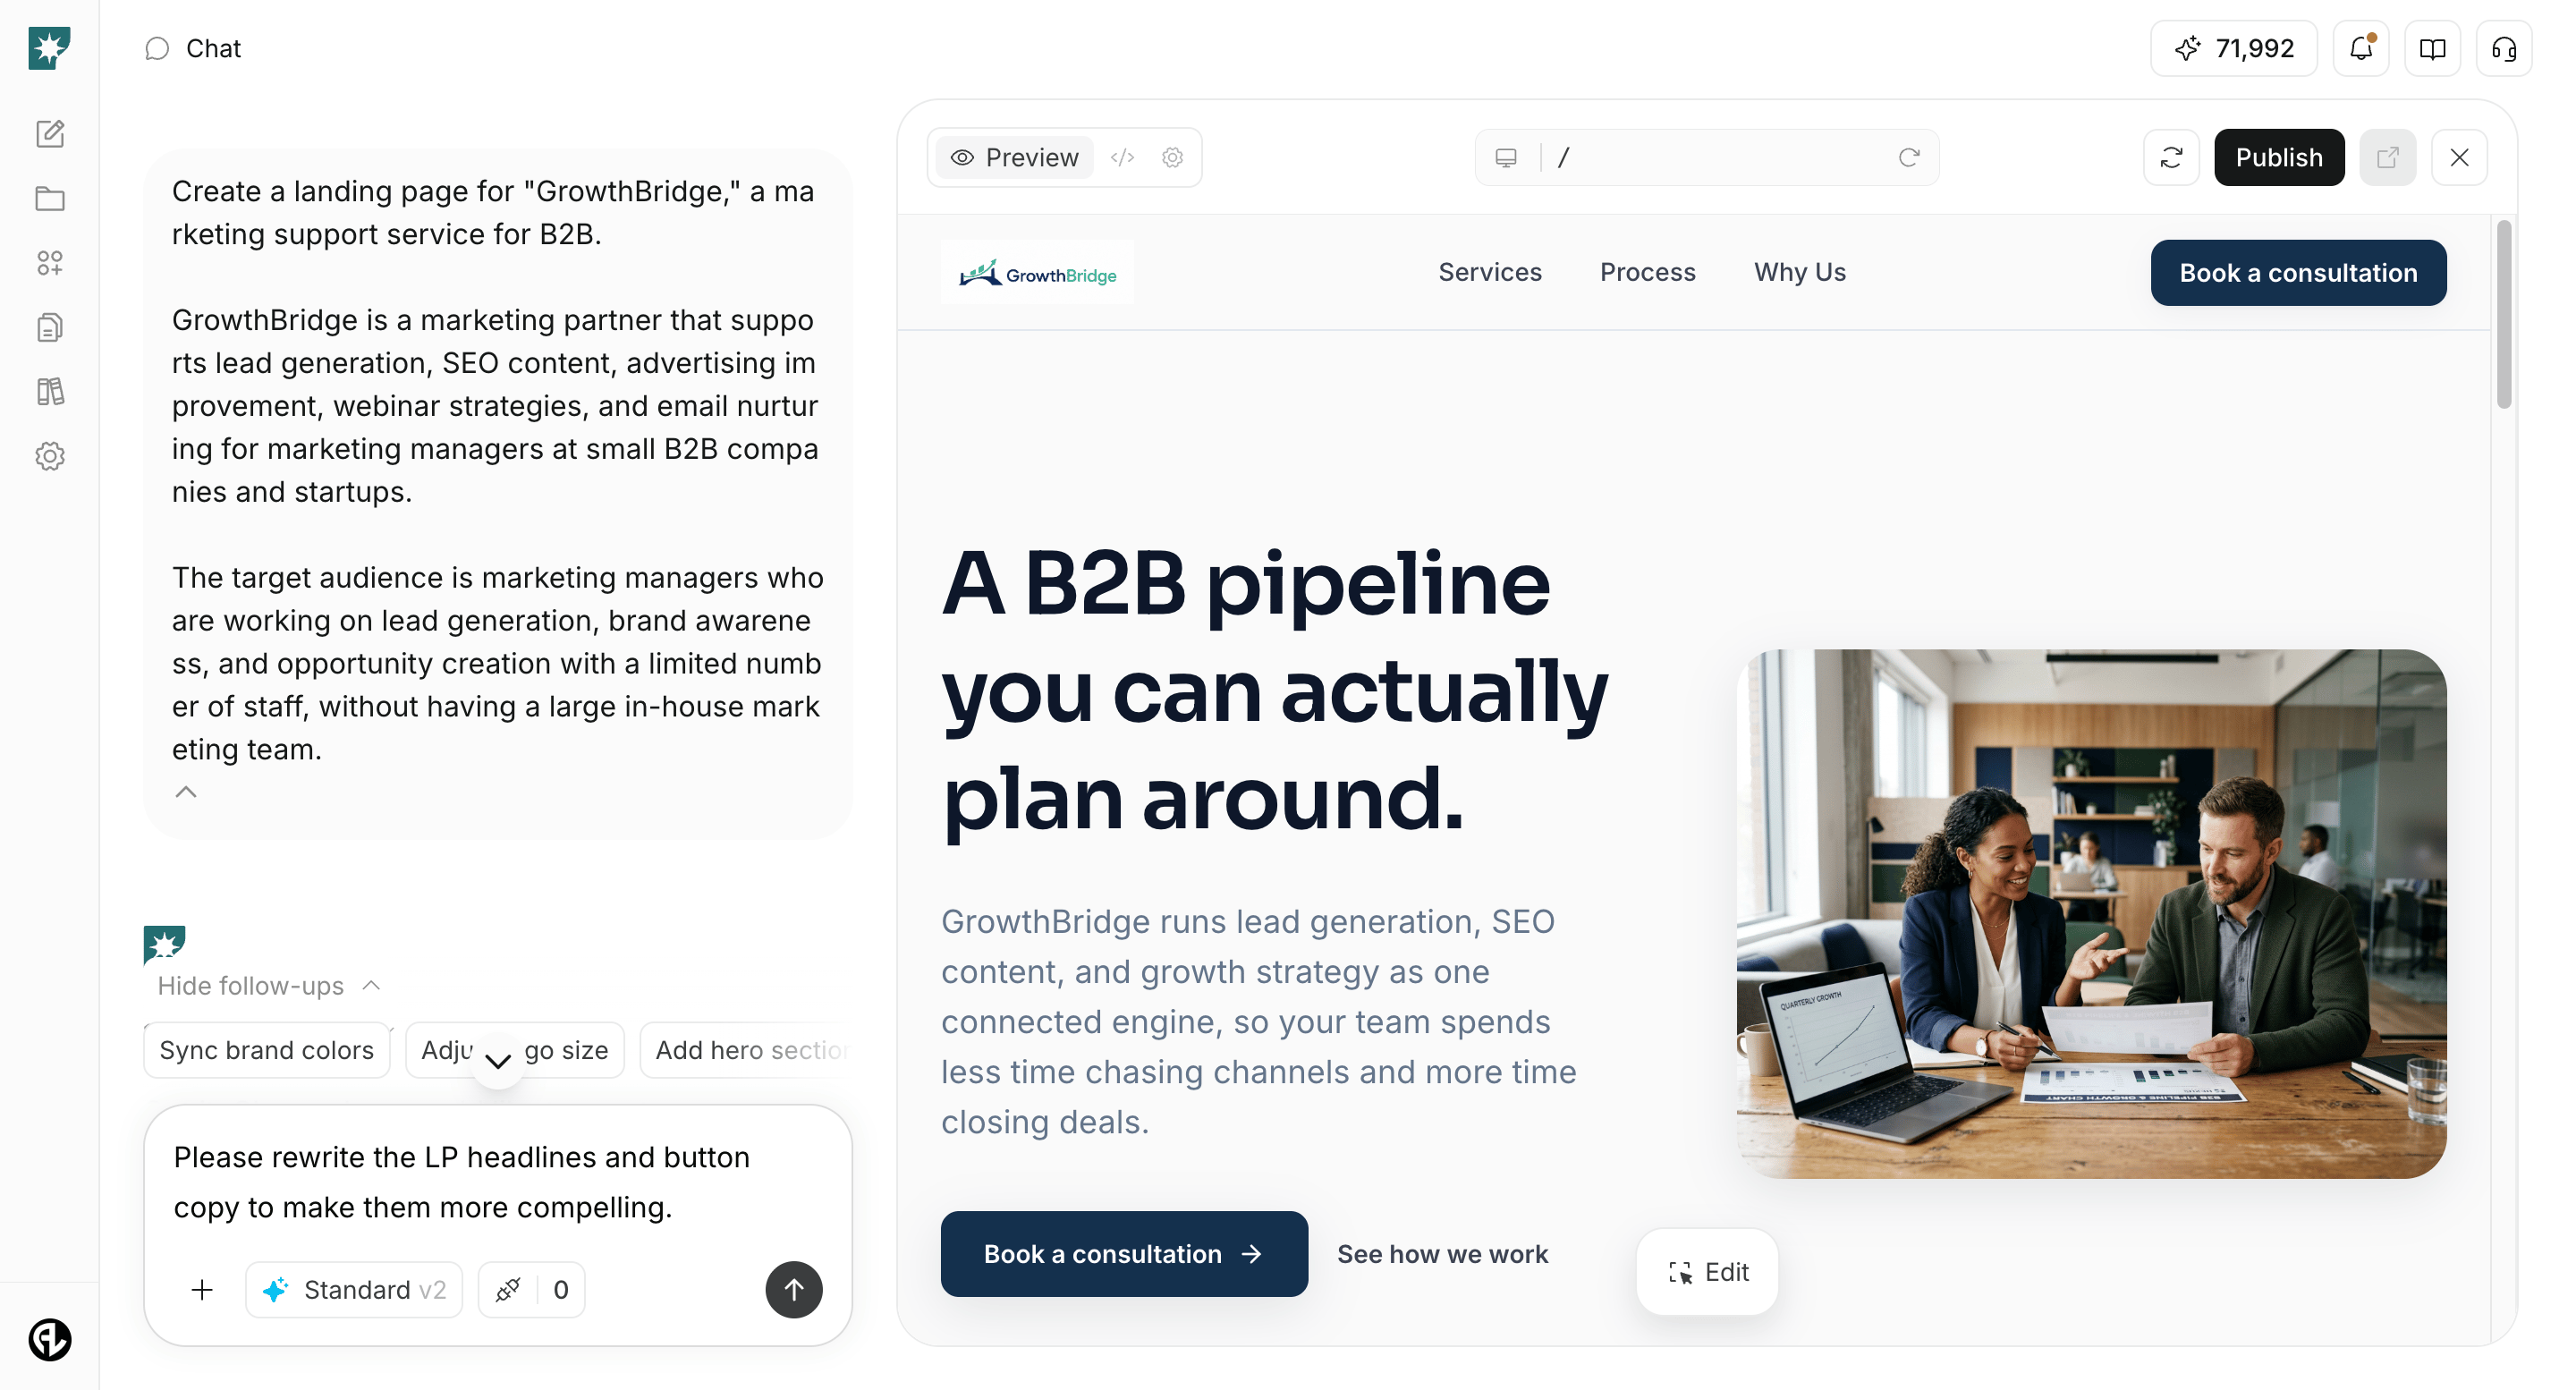
Enter the analysis for the chosen drop-off point and the current content of the target page or product screen into chat. Create fixes that address the causes and decide which metrics to check after the change.Prompt for chat
4. Compare CVR before and after changes to decide next improvements
After data accumulates for the change, compare before/after or A/B test results in chat. Keep conditions consistent outside the changed elements, and check not only sign-ups but also activation, paid conversion, and retention.Prompt for chat